Make the point in three seconds.
Simple design rules for Power BI visuals, each one shown bad and good with real HR data.

Power BI default. A field-name title, six colours that mean nothing, a legend that repeats the axis, and bars in alphabetical order. The reader has to find the point alone.

Redesigned. The title states the finding. Bars are sorted, grey is context, and one blue bar carries the point. Labels sit on the bars, so the axis and gridlines go.
Four things every visual gets judged on.
Most weak reports fail on one of these. Each has its own page of before-and-after examples.
Titles
Write the finding, not the topic. A reader who sees only the title should still get the message.
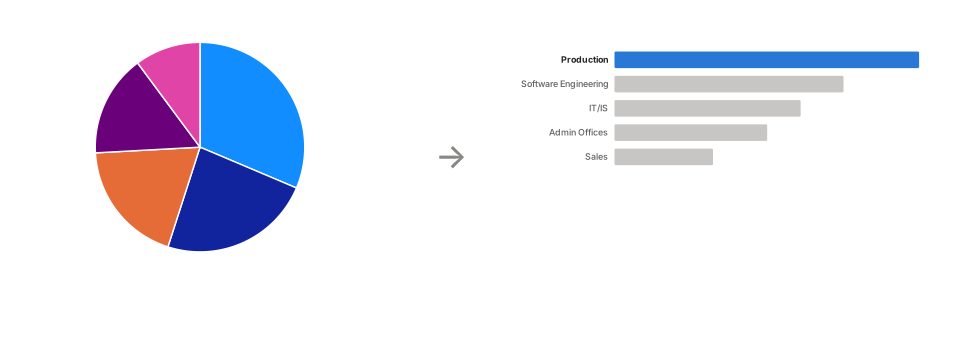
Pie and donut charts
People compare lengths far better than angles. Use bars, except for two or three parts of a whole.
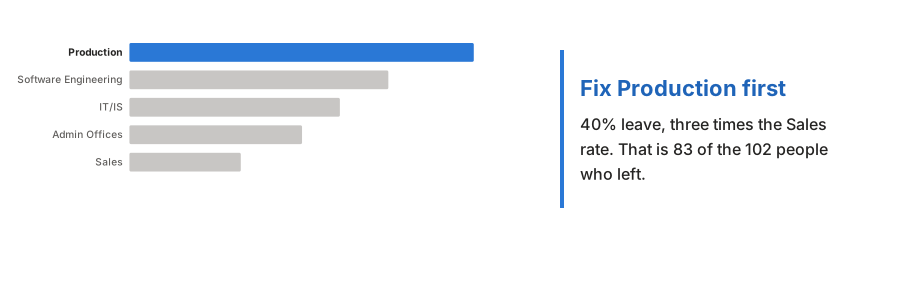
Callouts
On a presentation page, say what to do about it, in the same blue as the bar it explains.
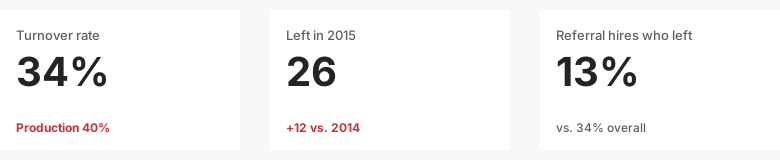
Cards
A number alone can't be judged. Give each card a comparison, and put the row top left.
Twenty-two rules, most important first.
The order is by how much each rule changes what a reader takes away. Each one links to examples and the Power BI setting that does it.
- 01Both
Decide: presentation or dashboard
The page either argues one point or lets the reader explore. Every other choice follows.
- 02Presentation
One page, one message
If the title needs "and" to join two claims, split the page.
- 03Both
Choose the chart from the message
Name the comparison first: ranking, change over time, part of a whole, relationship.
- 04Both
Grey everything, then one accent
Colour only the bar, line or number that carries the point.
- 05Both
Every number needs a comparison
A target, prior period or benchmark, shown on the visual.
- 06Both
Declutter until the data stands out
Borders, gridlines, markers, legends and decimals go unless they inform.
- 07Both
Lead with the answer, top left
3-30-300: headline and cards first, then charts, then detail.
- 08Both
Honest axes
Bars start at zero, the same unit gets the same scale, no dual axes.
- 09Both
Sort deliberately
By value, unless the categories have a natural order.
- 10Both
Label the data directly
Turn the legend off and name each series on the chart.
- 11Both
Data labels or axis, not both
With labels on, the value axis and gridlines go.
- 12Both
Align to a real grid
Equal, calculated gaps. A 4-8 px mismatch already looks wrong.
- 13Both
Fewer visuals, bigger main visual
Fill space with a bigger main visual, not more visuals.
- 14Both
Format numbers for people
$3.4M, not $3,412,887. Zero or one decimal on percentages.
- 15Both
Plain words, no field names
"Sum of Left" tells the reader a machine made the chart.
- 16Both
Same colour, same meaning
Once a colour means something, it means that everywhere.
- 17Both
Never rely on colour alone
A colourblind-safe palette, plus a sign, arrow or label.
- 18Both
One font, few sizes
Segoe UI, left-aligned, sentence case, nothing under 10 pt.
- 19Both
Skip gauges, 3D and radial charts
They look busy and hide the comparison.
- 20Dashboard
Slicers on the edge, never top left
Top left belongs to the answer.
- 21Presentation
Consulting page anatomy
Title, subtitle with units, exhibit, source and date, always in the same spots.
- 22Presentation
Story order across pages
Read only the titles in order and they tell the story.
One point, or many questions.
Every Power BI page is either a presentation or a dashboard. Good design looks different in each.
Presentation
Makes one point the reader acts on.
- Title
- The finding, with a number
- Visuals
- One or two
- Callout
- Often: what to do about it
- Cards
- One or two numbers, often as plain text
- Slicers
- None
Dashboard
Lets the reader explore.
- Title
- The question, since slicers change the numbers
- Visuals
- Many, read from the top left
- Callout
- Rarely: a filter can make it false
- Cards
- A top-left row, each with a comparison
- Slicers
- Grouped on one edge
Test your eye.
All three titles sit on the same chart of turnover by department. Which one does its job?